
End-to-End Tests With Playwright: Frontend, Backend and Database · Part 9 of 14 in the series
Part 9: When a Test Fails
Break the app on purpose and follow the trail: which sections turn red, what the error says, and how the trace shows the page, the actions and the network at the moment it went wrong.
End-to-End Tests With Playwright: Frontend, Backend and DatabasePart 9 of 14
On this page

Quest objectives
- Record a trace of every test and keep it for the ones that fail
- Read from the failed sections where in the app to look
- Read one of Playwright's error messages: the assertion, the locator, the call log
- Find the cause in the trace viewer: the page at every step and the requests it sent
- Use UI mode, --last-failed and --debug to rerun tests and step through them
- Know where flaky tests come from and what this suite does about them
52 tests, all of them green. Sooner or later one will be red, and that is what they are there for. What counts then is how quickly you get from the red test to the line that caused it.
This part is practice for that moment. You plant a small bug in the app, watch the suite catch it, and follow the trail with the tools Playwright gives you: the output in the terminal, the report, the trace and UI mode.
Record what happens
First make sure there will be something to look at. In playwright.config.ts, change the use block:
use: {
  // Record every test, and keep the recording of those that fail.
  trace: 'retain-on-failure',
  screenshot: 'only-on-failure',
},
A trace is a recording of everything a test did: every action, the page before and after each one, the requests the page sent, and what it wrote to the console. The setting from part 2, 'on-first-retry', makes a recording only when a failed test is run a second time. This config runs nothing a second time, so nothing has been recorded so far. 'retain-on-failure' records every test and throws the recording away if the test passes. screenshot: 'only-on-failure' adds a picture of the page at the moment a test fails.
Plant a bug
Now break something. In web/src/api.ts, change the line that creates a quest to this:
create: (title: string, reward: number) => call<Quest>('/quest', 'POST', { title, reward }),The path says /quest where it said /quests. One missing letter, the kind of slip that gets through a review. Run the suite:
$ npx playwright testRunning 52 tests using 8 workers# ... 48 lines with a ✓, and among them: ✘ 11 [frontend] › tests/frontend/form.spec.ts:29:1 › shows what the API says when it turns a quest down (5.3s) ✘ 9 [frontend] › tests/frontend/form.spec.ts:3:1 › sends a new quest to the API and shows it (5.3s) ✘ 49 [e2e] › tests/e2e/quest-board.spec.ts:55:1 › a title that is taken is turned down, all the way from the database (5.3s) ✘ 48 [e2e] › tests/e2e/quest-board.spec.ts:5:1 › a new quest travels from the form into the database (5.4s)# ... the first two errors, and then: 3) [e2e] › tests/e2e/quest-board.spec.ts:5:1 › a new quest travels from the form into the database Error: expect(locator).toHaveText(expected) failed Locator: getByRole('list', { name: 'Quests' }).getByRole('listitem') Timeout: 5000ms - Expected - 3 + Received + 1 - Array [ - /Find the lost sword.*50 gold/, - ] + Array [] Call log: - Expect "toHaveText" getByRole('list', { name: 'Quests' }).getByRole('listitem') with timeout 5000ms - waiting for getByRole('list', { name: 'Quests' }).getByRole('listitem') 14 × locator resolved to 0 elements 8 | await board.add('Find the lost sword', 50); 9 | > 10 | await expect(board.quests).toHaveText([/Find the lost sword.*50 gold/]); | ^ 11 | expect(await db.select().from(quests)).toMatchObject([ 12 | { title: 'Find the lost sword', reward: 50, done: false }, 13 | ]); at /home/robin/questboard/tests/e2e/quest-board.spec.ts:10:30# ... the last error, and at the end: 4 failed [frontend] › tests/frontend/form.spec.ts:3:1 › sends a new quest to the API and shows it [frontend] › tests/frontend/form.spec.ts:29:1 › shows what the API says when it turns a quest down [e2e] › tests/e2e/quest-board.spec.ts:5:1 › a new quest travels from the form into the database [e2e] › tests/e2e/quest-board.spec.ts:55:1 › a title that is taken is turned down, all the way from the database 48 passed (16.9s)
The session is shortened here; the lines that begin with # say what was left out. If your browser opens with a report at the end and the terminal waits, that is the HTML report from part 2. Stop it with Ctrl+C for now, it gets its turn below.
First: where? Before you read a single error, look at which sections failed. The summary at the end names the project of every failed test in square brackets. Run section by section, the picture is this (the counts of database, backend and e2e include the setup test that runs before them):
$ npm run test:database# 17 passed$ npm run test:backend# 19 passed$ npm run test:frontend# 2 failed, 10 passed$ npm run test:e2e# 2 failed, 4 passed
database and backend are green. So the data and its rules are fine, and the API does what it did before. frontend and e2e are red, and what those two have and the other two lack is the code that runs in the browser. In both, the failed tests are ones that add a quest. You have not read an error yet and already know where to look: in the frontend, at adding. This is the sections paying off.
Then: what? Now the error of the e2e test. Its first line names the assertion that failed, toHaveText, and below it stands the locator that was asked: the items of the list. Expected was one item with the new quest, received was an empty list. The call log says how Playwright got there: 14 × locator resolved to 0 elements. It looked fourteen times within the five seconds of the timeout, as web-first assertions do, and never found an item. So this is no matter of timing: the quest did not show up at all. The piece of source at the end marks the line of the test, and two lines above it stands board.add(…).
The errors left out above fit the picture. In the frontend section one of them shows an alert that reads "Failed to fetch": the request with the wrong path fits no mock, so the catch-all route of part 7 aborted it. And each failed test waited its five seconds, which is why the run took 16.9 seconds.
The error says what did not happen. It does not say why. For that you have to see what the test saw.
The report and the trace
Open the report of the last run:
$ npx playwright show-report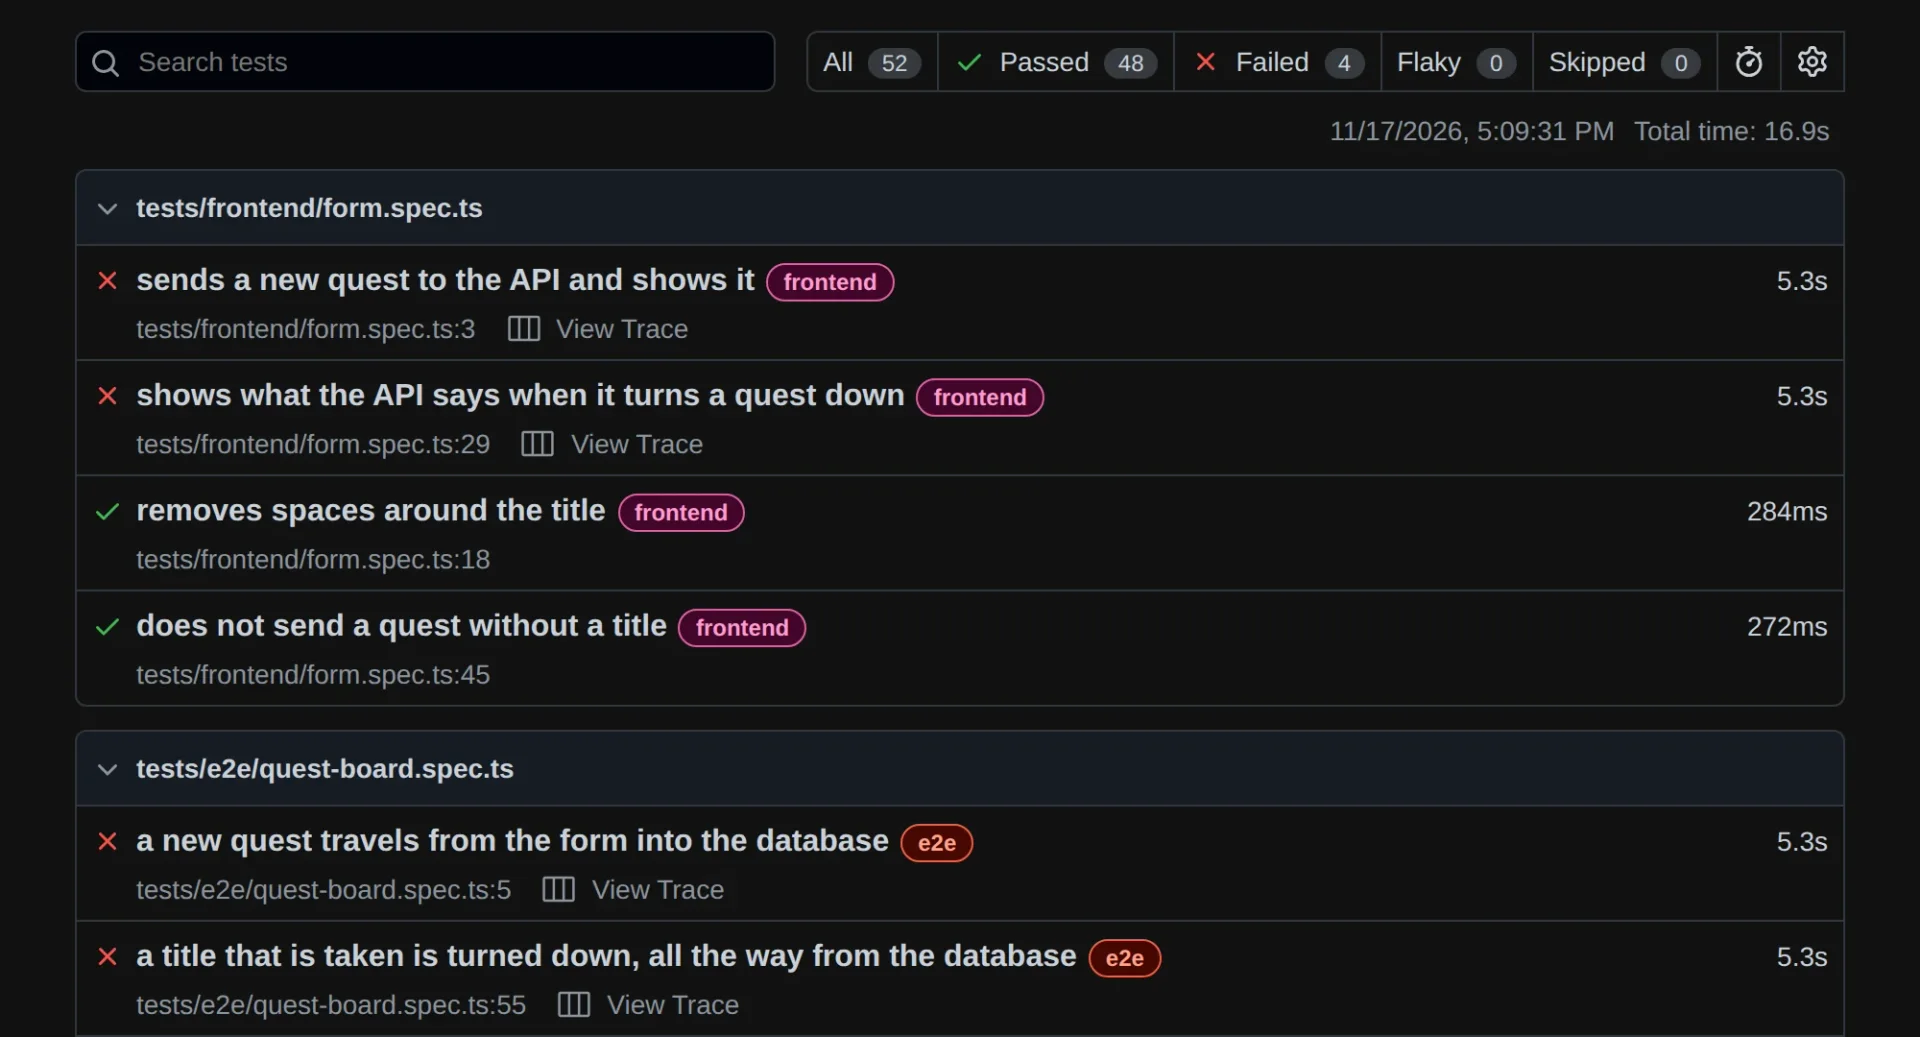
The report puts the files with failures on top and labels every test with its project. A click on a test opens its page with the error, the steps of the test and the screenshot from the moment it failed. Under each failed test is the link View Trace. Click the one for "a new quest travels from the form into the database", or open the same trace from the terminal. The output of the failed run prints the command for it under each error:
$ npx playwright show-trace test-results/quest-board-a-new-quest-tr-37a45--the-form-into-the-database-e2e/trace.zip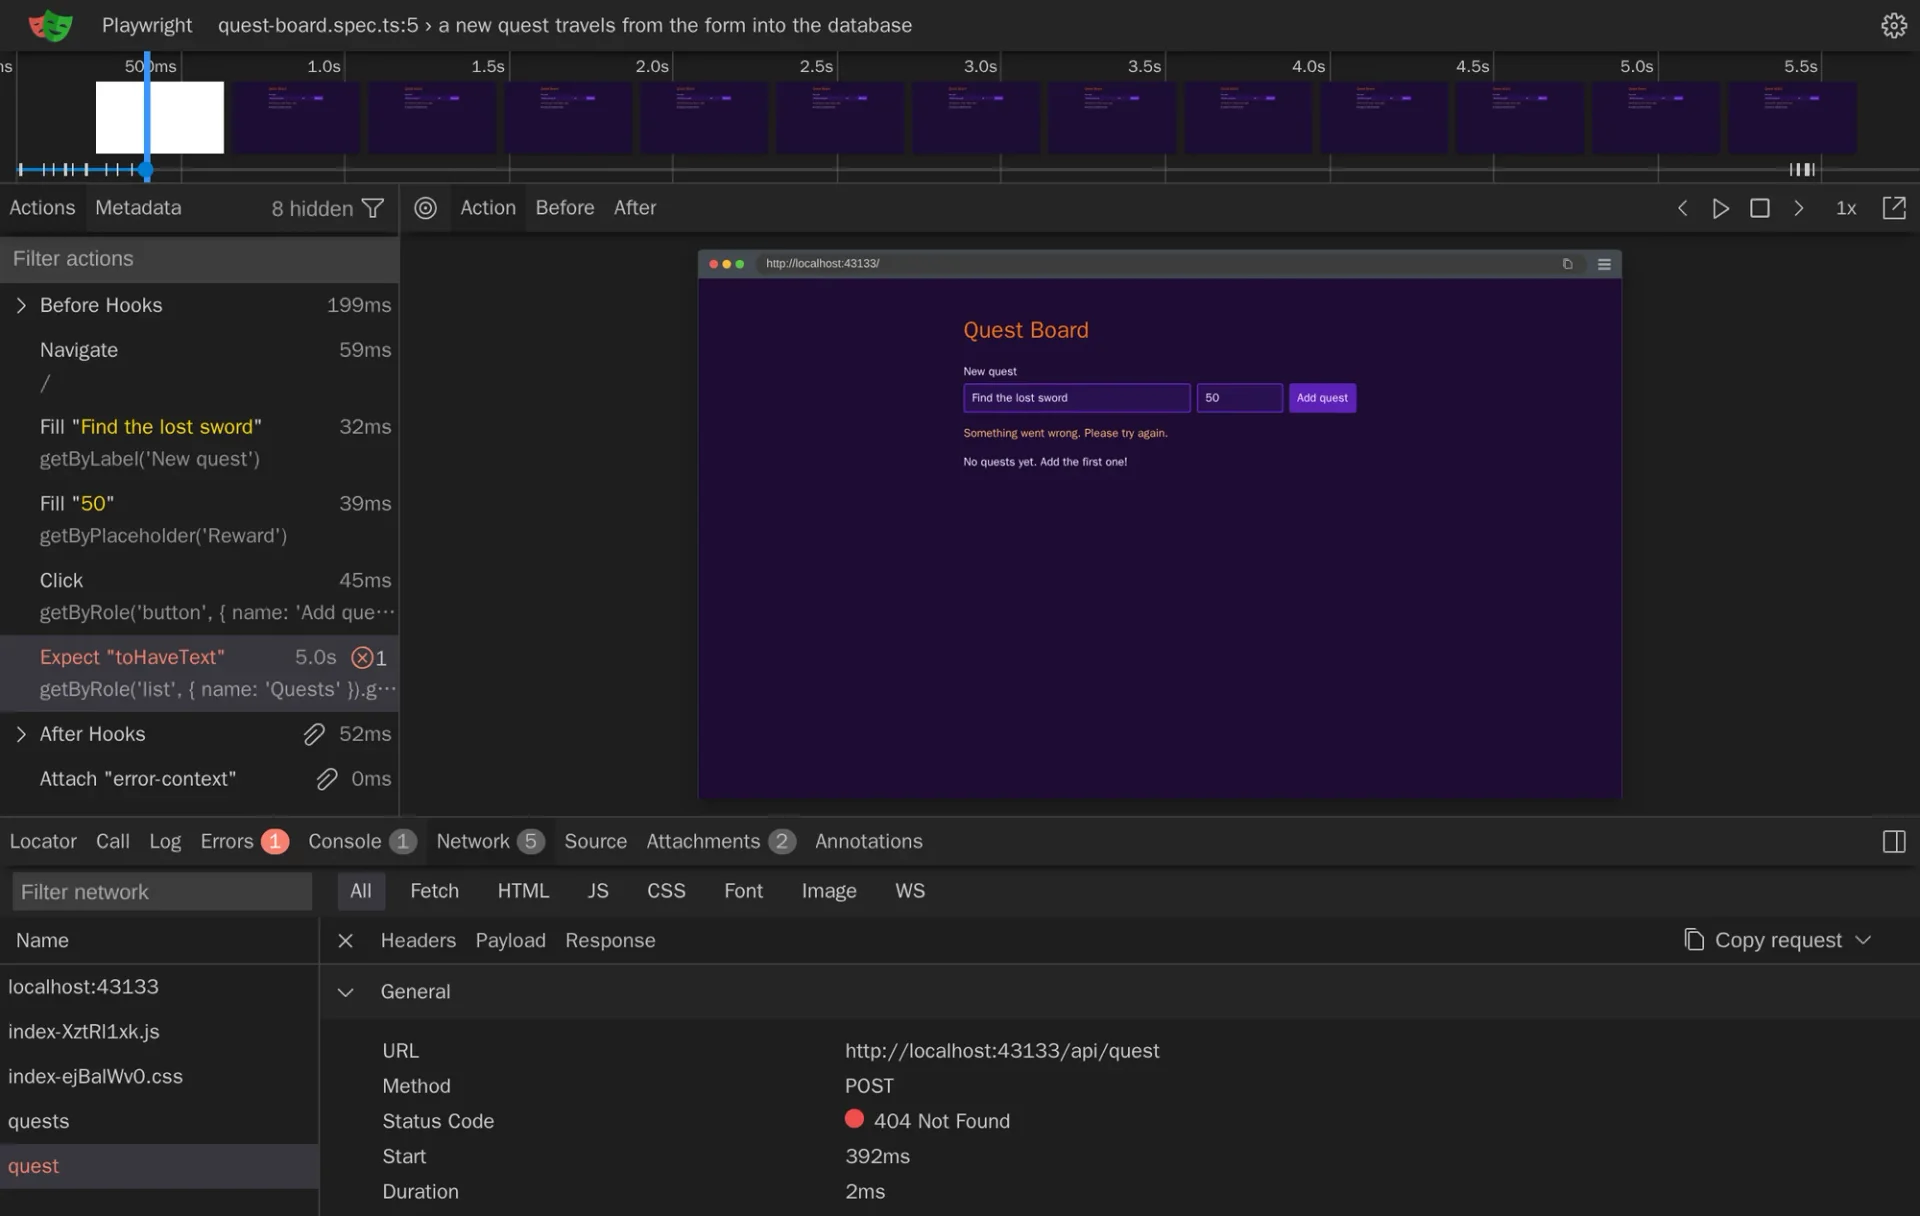
The trace viewer shows the test as a sequence you can walk through. On the left are its actions in order: it opened the page, filled in two fields, clicked the button, and then, in red, the expectation that waited five seconds. In the middle is the page as it was at the action you select, and the tabs above it switch between the moment before and the moment after. Across the top runs a strip of small pictures over the whole time. The tabs at the bottom hold the details, among them the console, the network and the source of the test.
Click the red Expect. The page in the middle shows the form, still filled in, and under it "Something went wrong. Please try again." So the page did send the quest and got a no. But look at the sentence: it is not one of the API's. It is the fallback in call in web/src/api.ts, used when an answer is not OK and brings no message of its own. Every refusal of the API brings one. So whatever answered here was not one of the API's routes.
Open the Network tab at the bottom. It lists what the page asked for: the document, a script, a stylesheet, then quests, the list it loaded at the start, and in red quest. Select that one: a POST to /api/quest, answered with 404 Not Found. There is no such route. The page asked for quest without the s, and a search for '/quest' in web/src leads straight to the line you changed.
That is the whole way from a red test to the faulty line, without a console.log and without clicking through the app by hand.
UI mode
The report and the trace look at a run that is over. UI mode puts the same view around tests while you run them:
$ npx playwright test --ui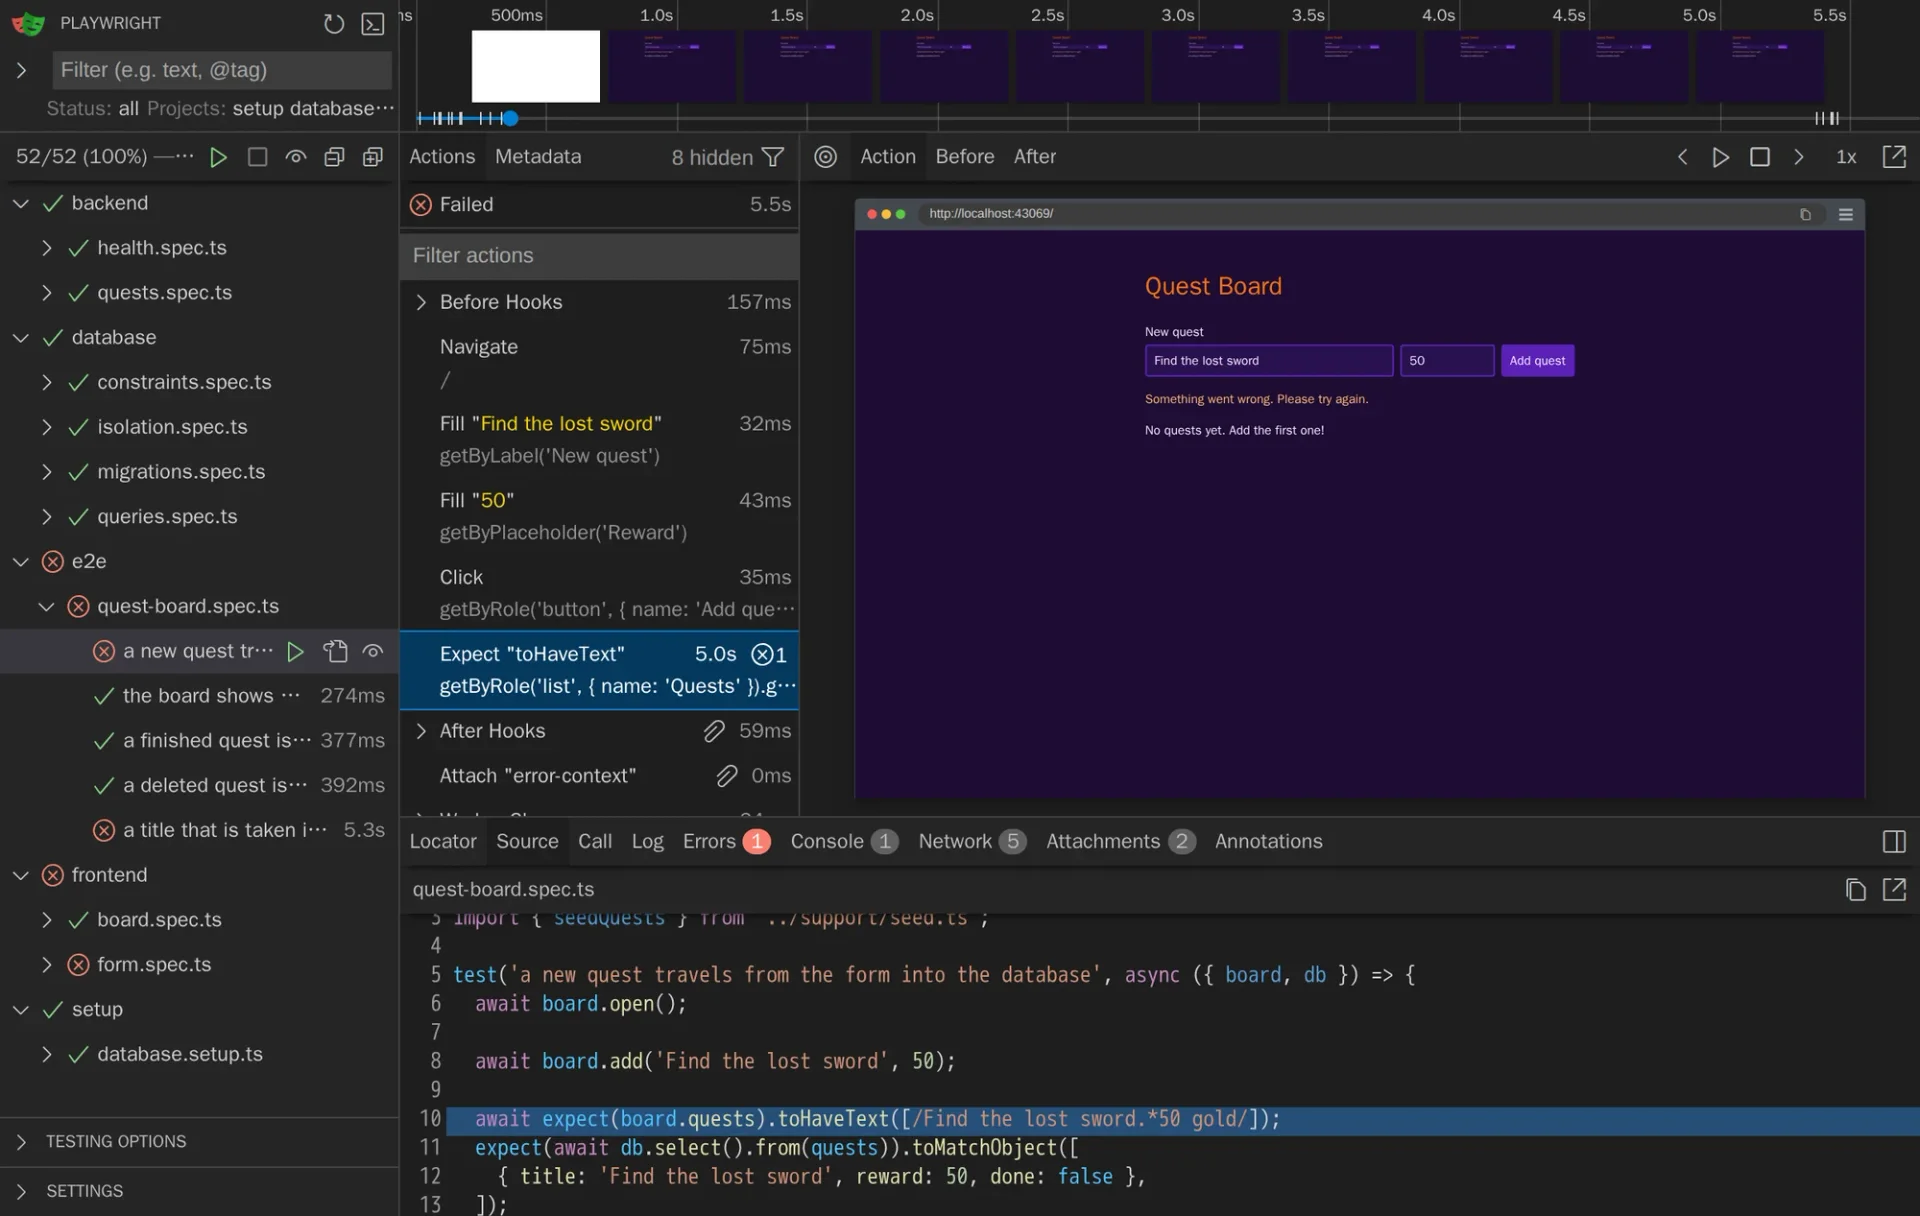
On the left is the tree of your suite: projects, files, tests. A triangle beside an entry runs it, and the one at the top runs everything in the list. Select a test, and the right side shows what you know from the trace viewer: the actions, the page at each of them, and at the bottom the tabs, here with the source of the test and the line that failed. You do not open a trace file for it, and while a test runs, its actions appear as they happen.
The eye beside an entry turns on watch mode for it: Playwright then runs the test again when you change its code. For writing a new test that is a short loop: type, save, look.
The frontend is built once, when UI mode starts, by the command in webServer. So after a change to code under web/, restart UI mode to test the new build. Changes to tests and to server code are picked up on the next run without a restart.
Narrow it down
Back in the terminal, a few options keep a run small while you are after one failure:
# Only the tests that failed in the last run$ npx playwright test --last-failed# Only the tests whose title contains these words$ npx playwright test -g "travels from the form"# One file, or one test by its line$ npx playwright test tests/e2e/quest-board.spec.ts:5# Step through a test in a browser you can see$ npx playwright test tests/e2e/quest-board.spec.ts:5 --debug
--last-failed is the one for the time after a fix: it runs what was red in the last run, plus the setup those tests depend on, and nothing else. -g picks tests by words from their title, and a path with a line number picks the one test that begins there.
--debug opens a browser you can see, together with the Playwright Inspector: a window in which you run the test action by action and look at the page after each one. A line await page.pause() in a test does the same at a spot you choose, whenever the test runs in a visible browser, be it with --debug or with --headed from part 2.
Tests that fail only sometimes. One kind of failure does not hold still for any of these tools: the test that is red in one run and green in the next, a flaky test. Playwright can run a failed test again, and the report then lists a test that passed on a later try as flaky, which is what the filter of that name in the report is for. Retries get you a green run, but they also hide the problem, and a flaky test has a cause. The usual ones are a fixed wait that is sometimes too short, and data that tests share. This suite avoids both by the way it is built: its assertions wait for what they expect, expect.poll waits for the database, and every worker has a database of its own that is emptied before each test.
Fix it. Put the s back into web/src/api.ts and run npx playwright test once more in the terminal. Every run there starts by building the frontend afresh, so the fix is in the pages the tests open, and the run ends with 52 passed again.
What you have now
A suite that records what it does, and a routine for the day a test is red: first the sections, to know where. Then the error, to know what. Then the trace, to see why. UI mode and a handful of options keep the way back to green short.
So far the app has stood still while the tests grew around it. In the next part the app changes: the quest board gets a login, and the suite has to keep up.
Comments
The comments are GitHub Discussions: sign in with GitHub to write one.
The comments come from GitHub, through giscus. Loading them sends your IP address to giscus.app and GitHub.